Warming & Cooling Curves
When energy is added or removed from a substance, phase changes occur. Below are the 5 basic phase changes:
1. Melting- Energy added to a solid so it turns into a liquid
2. Freezing- Energy removed from a liquid so it turns into a solid.
3. Vaporization- Energy added to a liquid so it turns into a gas (2 types- boiling- fast; evaporation- slow)
4. Condensation- Energy removed from a gas so it turns into a liquid.
5. Sublimation- Energy added to a solid so it turns directly into a gas.
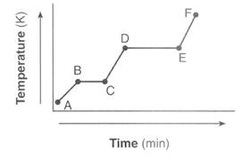
On a warming curve (shown above), the slopes are the 3 single phases and the plateaus are the phase changes. The shape of this graph is universal with the exception of the location of the plateaus. The first plateau will occur at the normal melting point of the solid and the second will occur at the normal boiling point of the liquid.
1. Melting- Energy added to a solid so it turns into a liquid
2. Freezing- Energy removed from a liquid so it turns into a solid.
3. Vaporization- Energy added to a liquid so it turns into a gas (2 types- boiling- fast; evaporation- slow)
4. Condensation- Energy removed from a gas so it turns into a liquid.
5. Sublimation- Energy added to a solid so it turns directly into a gas.
On a warming curve (shown above), the slopes are the 3 single phases and the plateaus are the phase changes. The shape of this graph is universal with the exception of the location of the plateaus. The first plateau will occur at the normal melting point of the solid and the second will occur at the normal boiling point of the liquid.
|
|
Time Interval
A-B B-C C-D D-E E-F |
The substance is...
warmed as a solid melting warmed as a liquid boiling warmed as a gas |
Temp (Avg Kinetic Energy)
increasing no change increasing no change increasing |
Potential Energy
no change increasing no change increasing no change |
As you can see above, if the temperature is changing, then there is a change in kinetic energy but no change in potential energy. If there is a phase change, the temperature is remaining the same, so there is no change in kinetic energy but there is a change in potential energy. A cooling curve would have the same plateaus, but they would be in reverse and the energy would decrease.
Calculating Heat

To calculate the heat transferred in a reaction, you would need to use the formula Q = mc(delta T). The Q stands for heat (measured in Joules), the m stands for mass (measured in grams), the c stands for specific heat capacity (measured in J/g deg C) and the Delta T stands for change in temperature (measured in deg C). If heat is being absorbed, Q would be a (+) value. If heat is being released, Q would be a (-) value.
Phase Diagrams
On any phase diagram, it shows the pressure & temperature conditions for a solid, liquid or gas phase of a particular sample. The point where the S, L & G lines meet is called "The Triple Point." This is the point where the S, L & G phases of the substance coexist under the particular pressure & temperature conditions. The point in the upper right hand corner is "The Critical Point." This is the point where a gas cannot be liquified above it, regardless of P and T conditions. These phase diagrams explain how an ice skater glides across the ice (an increase of pressure on the ice temporarily melts the ice which then refreezes after the skater moves on) or how propane is stored for bar-b-que grills.
|
|
| ||||||
